Measurement
The product is the instrument.
The holdout
Five of every hundred never get our emails.
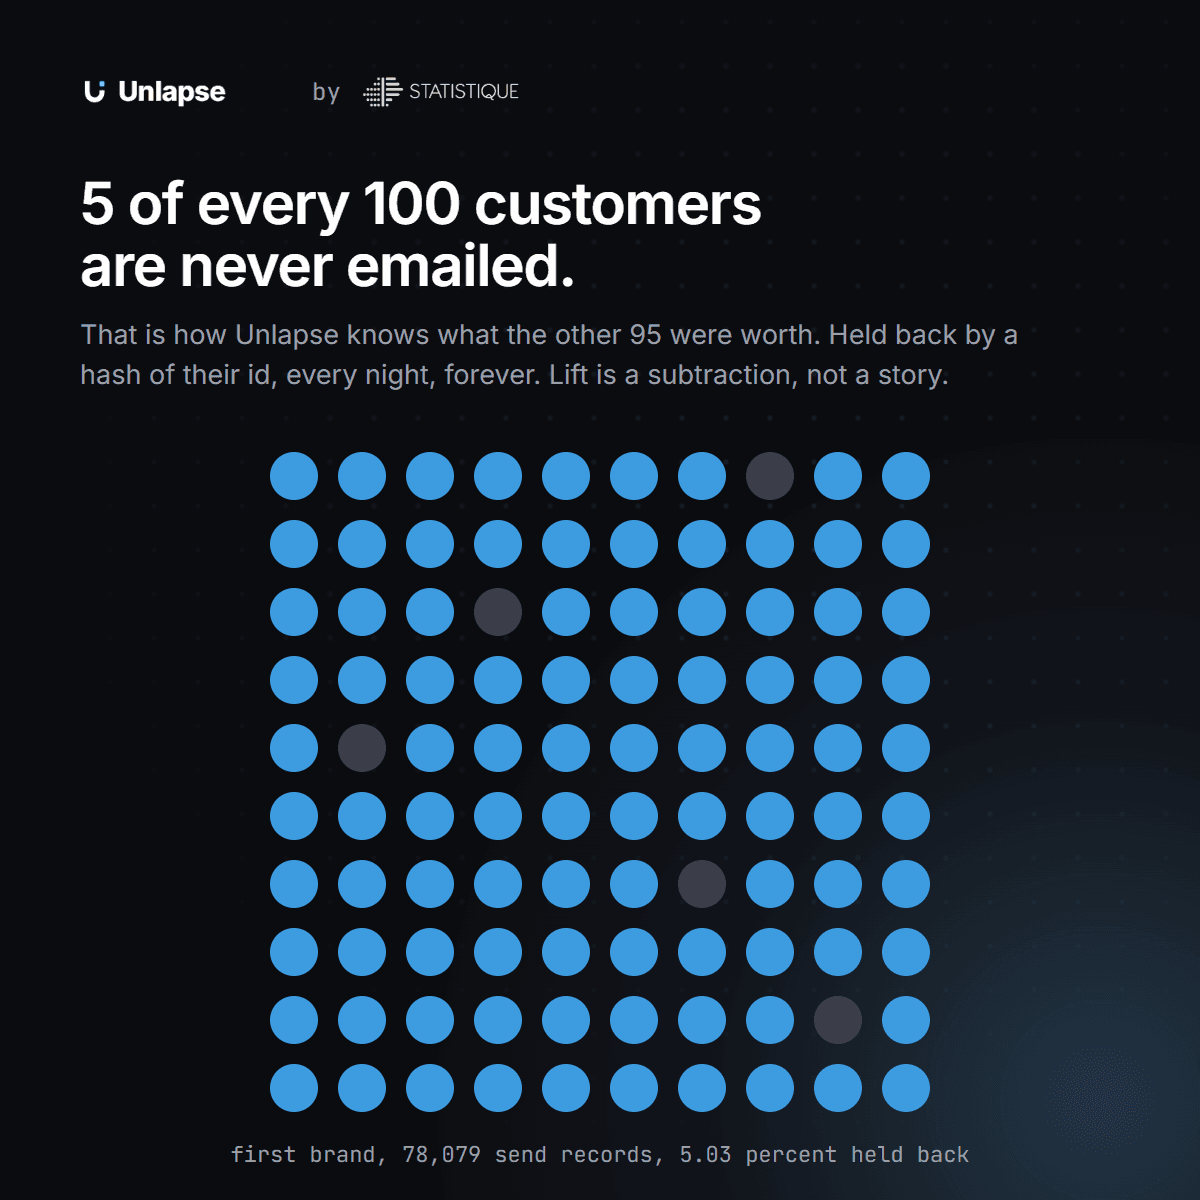
What the holdout says on the first brand, today
The measured lift is not settled, and Unlapse says so. Every read at 14 days and longer since August has been not distinguishable from zero in aggregate: the engaged base mostly buys anyway, and until a deconfliction segment went live in September the control was contaminated by the brand's own campaigns. A clean read restarted on 14 Sep 2026. We quote no lift figure as a result. The claim is the instrument, and that it reports “nothing” when the answer is nothing.
Calibrated probabilities
The highest score anywhere in the system is 0.598. Nothing reads 99 percent.
| Campaign | Held-out ECE | Customers |
|---|---|---|
| Dormant | 0.0005 | 296,438 |
| Reactivation | 0.0016 | 65,135 |
| Win-back | 0.0063 | 28,040 |
| Resubscribe | 0.0099 | 12,404 |
| Second order | 0.0205 | 7,169 |
| Campaign | Highest calibrated score |
|---|---|
| Second order | 0.598 |
| Resubscribe | 0.439 |
| Reorder | 0.404 |
| Win-back | 0.311 |
| Cross-sell | 0.186 |
| Reactivation | 0.164 |
| Subscription | 0.089 |
| Dormant | 0.058 |
Walk-forward grading, every night
Each model is graded against the rule it replaced. The table records the losses.
| Model | ROC-AUC | Customers | Base rate | Top 1,000 | Baseline, top 1,000 |
|---|---|---|---|---|---|
| Reorder, buys within 60 days | 0.7835 | 302,671 | 0.84% | 32.5% | 0.84% |
| Subscription, starts within 90 days | 0.7008 | 302,169 | 0.51% | 8.2% | 0.3% (heuristic) |
| Cross-sell, new product within 90 days | 0.5849 | 50,767 | 14.0% | 15.5%loses | 20.9% (co-purchase rule) |
The models are given a budget and mostly refuse to spend it. The reorder model may nominate 15,000 candidates a night and the subscription model 5,000; on 21 Sep 2026 648 customers were assigned the reorder campaign and 379 the subscription one, because every nominee still has to clear the segment, cadence and product gates.
The rule-based lapsed tiers are graded separately, on an 89 day held-out window rebuilt from order history alone: win-back, reactivation and dormant customers came back at 5.37%, 2.10% and 0.81%.
Attribution, labelled
Attribution at 2, 7 and 14 days, beside the holdout.
Orders placed within the window after a send. The industry-standard number. Not causation.
What the emailed group did minus what the held-back group did anyway, with a confidence interval. The only number that says what the emails caused.
Head to head
Against the incumbent retention tool, including the two comparisons that were not wins.
| Comparison | Unlapse | Incumbent | Result |
|---|---|---|---|
| Reorder, ROC-AUC | 0.6517 | 0.4645 | Win |
| Reorder, precision at top 500 | 54.8% | 29.0% | Win |
| Reorder, median predicted-date error (days) | 12.2 | 29.3 | Win |
| Win-back, ROC-AUC | 0.7374 | 0.4766 | Win |
| Win-back, precision at top 1,000 | 39.0% | 18.2% | Win |
| Cross-sell, field comparison | 0.451 | 0.481 | Tie |
| Subscription ranking | 21 starts | 21 starts | Inconclusive |
All figures are from the first brand the engine runs for, a subscription-driven DTC brand. Model figures are one night's snapshot, 21 Sep 2026, unless another date is given.
Tell us about your store.
Ask us to show you the holdout report on your own orders after the audit.